The UpSlide Gantt feature makes it simple to create and maintain project plans directly within your PowerPoint presentations.
Prerequisites
To use UpSlide’s Gantt Charts in PowerPoint, please follow the prerequisite steps:
Create a Gantt Chart
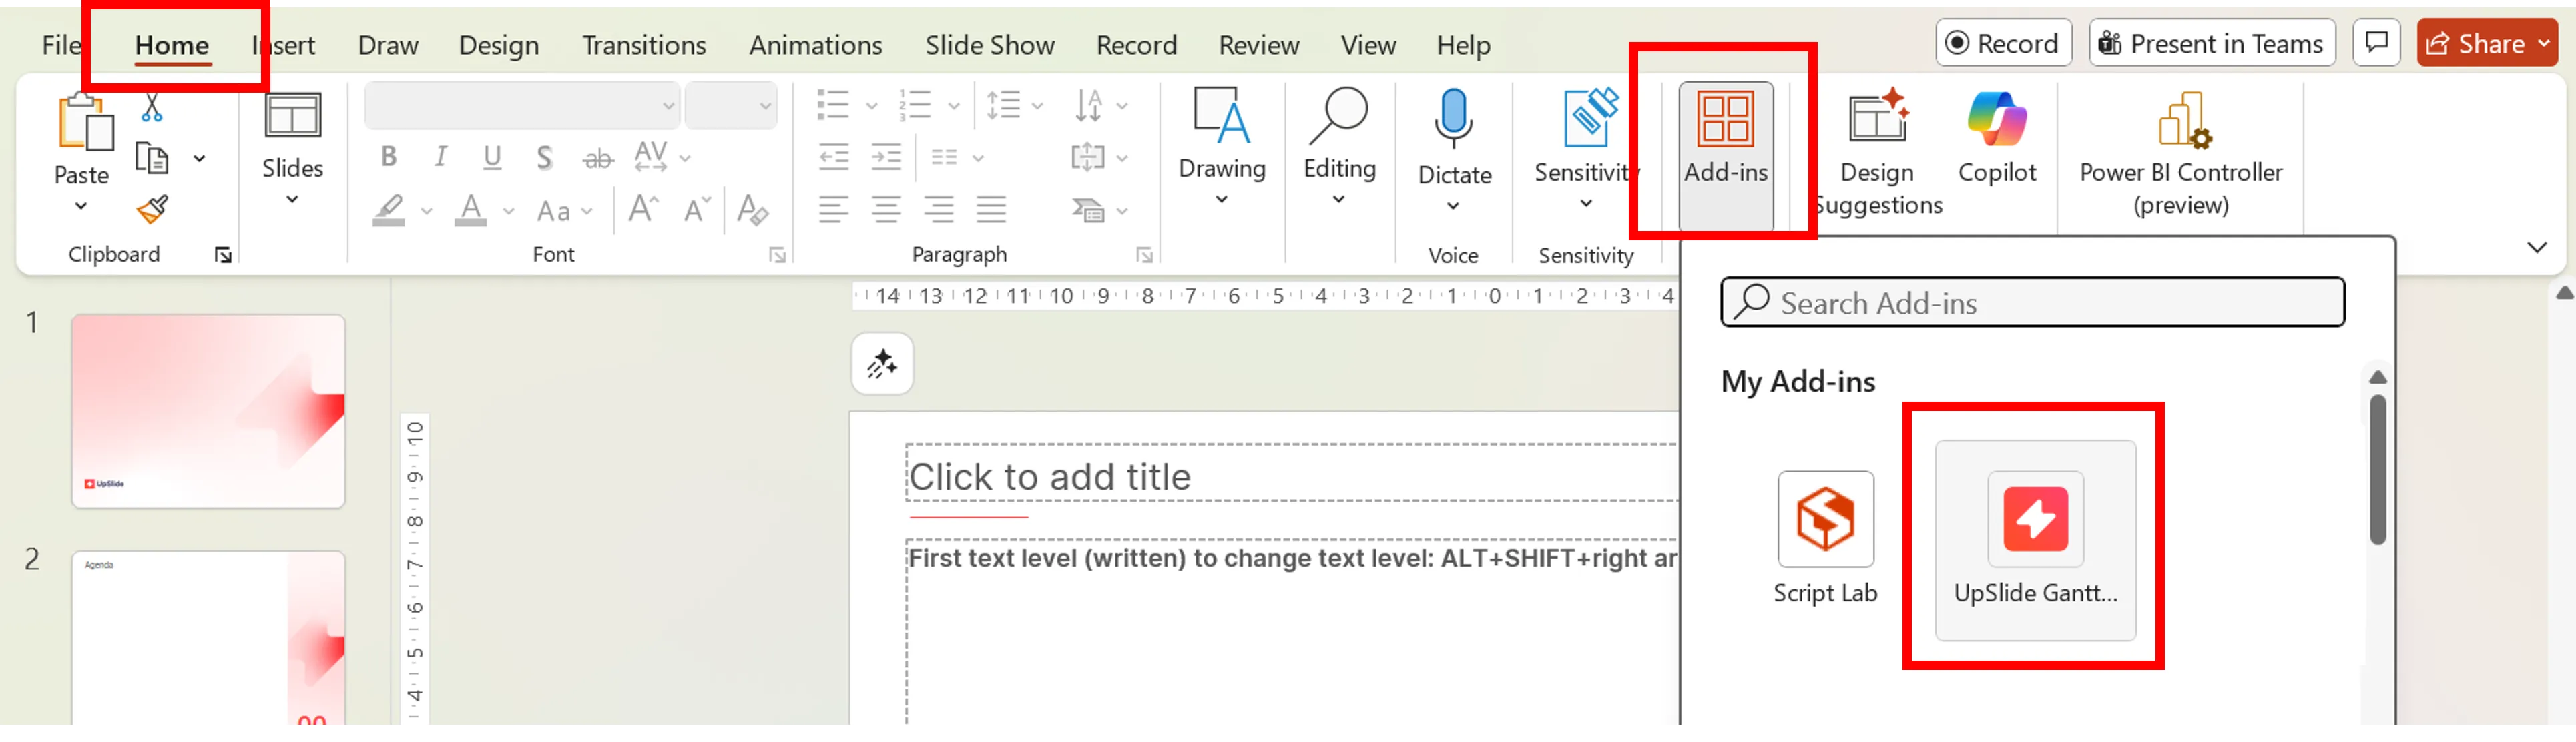
When UpSlide’s Gantt Charts has been deployed, you can find the feature in the UpSlide ribbon or in Home > Add-ins > UpSlide Gantt.
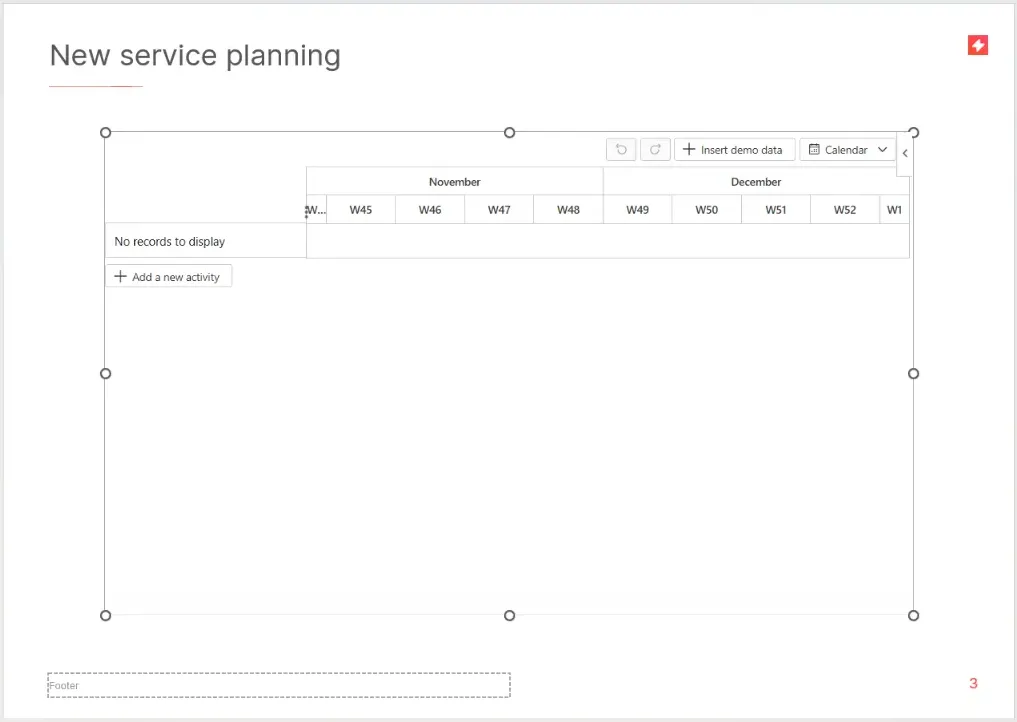
Clicking the Gantt Charts button inserts a Gantt shape in the middle of your slide, starting at the current date. The chart is inserted on top of the slide’s placeholders.
Set up the calendar
The calendar defines the timeframe you want to display. Any activity that falls outside the timeframe still exists in your Gantt chart, but will not be visible unless you update the timeframe.
To set your timeframe, click Calendar, and in the dialogue box that appears, you can :
- Set the date range. Choose the start and end dates for your timeline.
- Use Auto scale. Automatically adjust the timeline to the first activity start date and the last activity end date. This automatically updates the From and To dates.
- Define column headers. Choose up to two column headers from the following options: year (Y), quarter (Q), month (M), week (W) and day (D).
The finer the time intervals, the harder they will be to read. To update the width of the time intervals, you can resize the entire Gantt chart shape to the size of your slide or adjust the width of the activity list. This will automatically adjust the width of the columns.
Add elements to your Gantt chart
You can populate the Gantt chart with different elements:
- Activities. Represent the main project phases. They can be used to group sub-activities, detail specific tasks or stages.
- Milestones. Key events in the project, including meetings and submission dates. Unlike activities and sub-activities, milestones have a single precise date rather than a date range.
- Sub-activities. Define specific or individual tasks within a phase. They are a subdivision of an activity.
You can click Insert demo data to see what your Gantt chart can look like and update the elements from there.
Add a new activity, milestone or sub-activity
Activity
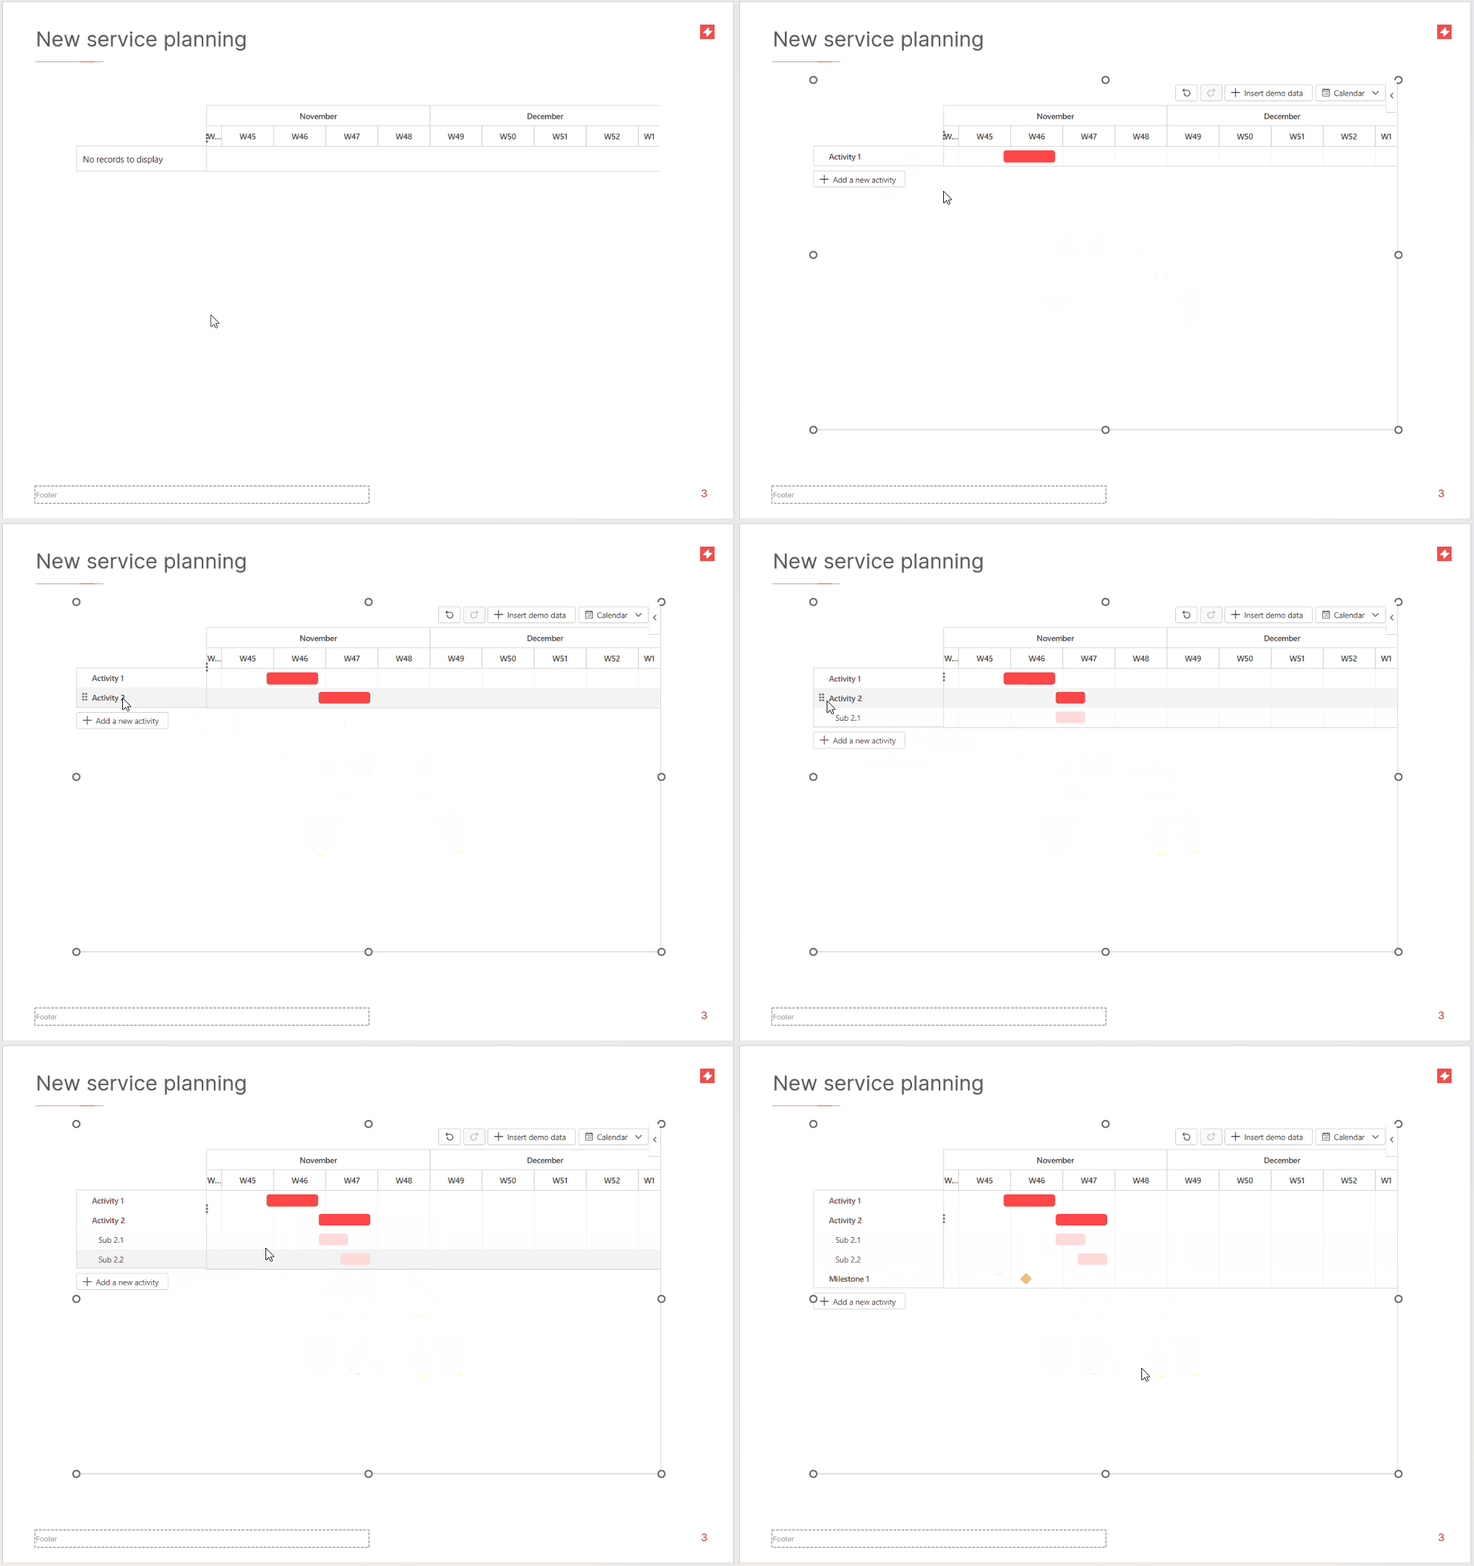
To add a new activity to your Gantt chart, you can click the Add a new activity button under your Gantt chart or right-click the activity column and select Add > Activity.
For each new activity you add, enter a name and timeframe.
Milestone
To add a new milestone, right-click the activity column and select Add > Milestone. Each milestone is defined by a name and date.
Sub-activity
A sub-activity cannot exist independently and must be affiliated with an existing activity. Right-click an activity to select Add > Sub-activity. Enter a name and a timeframe for the sub-activity.
Sub-activities define the start and end dates of the parent activity. Adding a sub-activity automatically adjusts the start and end dates of the parent activity.
If you right-click a milestone instead of an activity to add the sub-activity, the milestone will automatically become an activity with a start and end date matching the sub-activity’s.
You can adjust any element’s name and dates by right-clicking it and selecting Edit.
Set colours

To improve readability and help differentiate activities, you can change the colours by right-clicking an element and selecting Colors. The colours available vary depending on your Slide Master’s colour theme.
Add dependencies
You can add dependencies to activities to signify that the one starting depends on the other one being finished. To set a dependency:
- Hover over the end of Activity 1 and maintain a click on the blue circle.
- Drag and release over the start of Activity 2.
- An arrow appears, indicating the dependency.
When a dependency is set, Activity 1’s start date is dynamically linked to Activity 2’s end date.
- If Activity 1’s end date is moved, it will automatically update Activity 2’s start date.
- If Activity 2’s start date is moved, it will create a new time interval between the two activities.
To remove a dependency, right-click on an activity to select Edit > Dependencies. Click the trash can next to the dependency to delete and save the change.
Display Gantt charts charts for non-UpSlide users
If you send a PowerPoint presentation containing a Gantt chart to a non-UpSlide user, the chart will not appear.
To avoid this happening, you can save the chart as an image:
- Click on the UpSlide Gantt Chart.
- Select the < symbol in the top right-hand corner of the chart.
- Select Show as Saved Image.
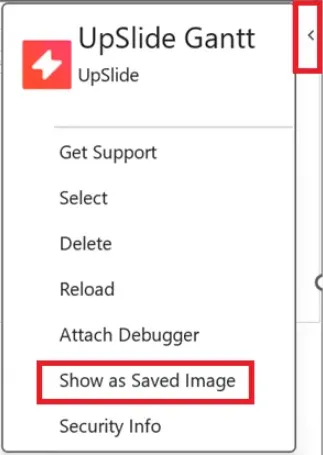
This functionality creates a picture of the Gantt chart that cannot be edited. To make the chart editable again, go back to the same menu and uncheck Show as Saved Image.
When a Gantt chart is saved as an image, the calendar, activity and demo buttons are greyed out. This is an Office limitation.