This article guides you through the steps of deploying UpSlide's Gantt Charts option in PowerPoint.
Add-in installation
You can deploy the UpSlide Gantt Charts via the Microsoft integrated apps. To deploy an Office application to your organization, you’ll need Global Administrator rights.
- Click here to access the integrated apps of your organization
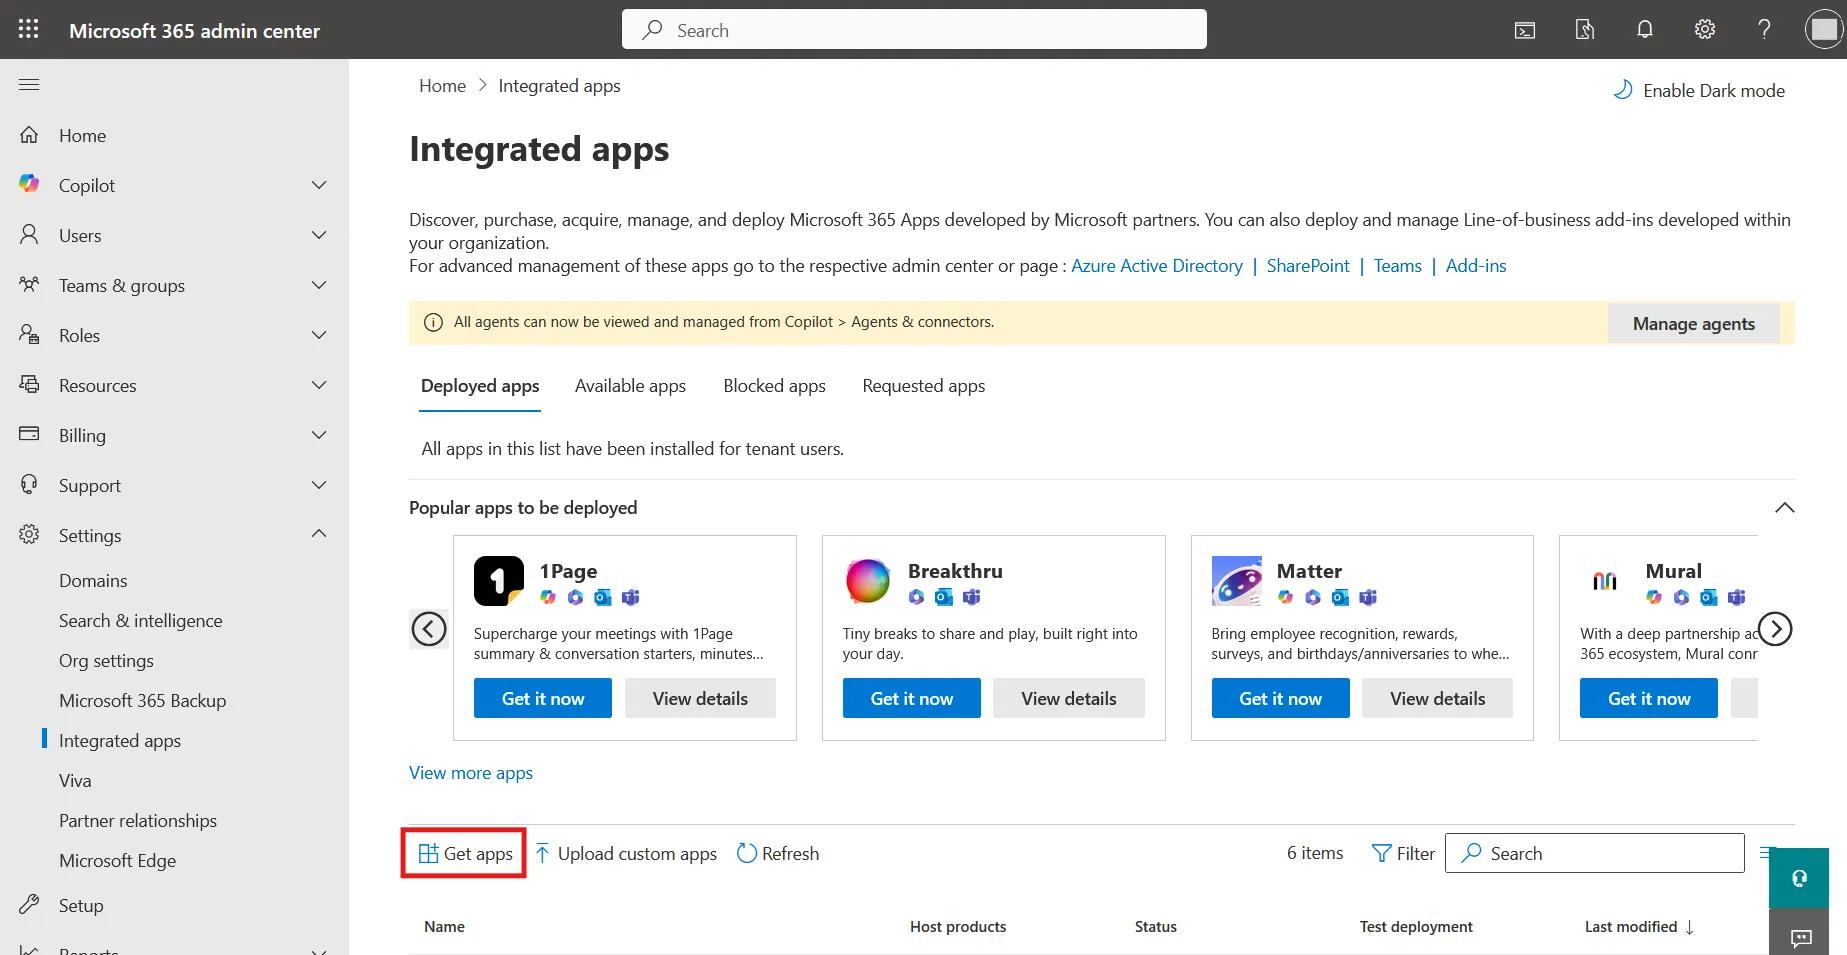
- Click on the Get Apps button on the integrated apps table
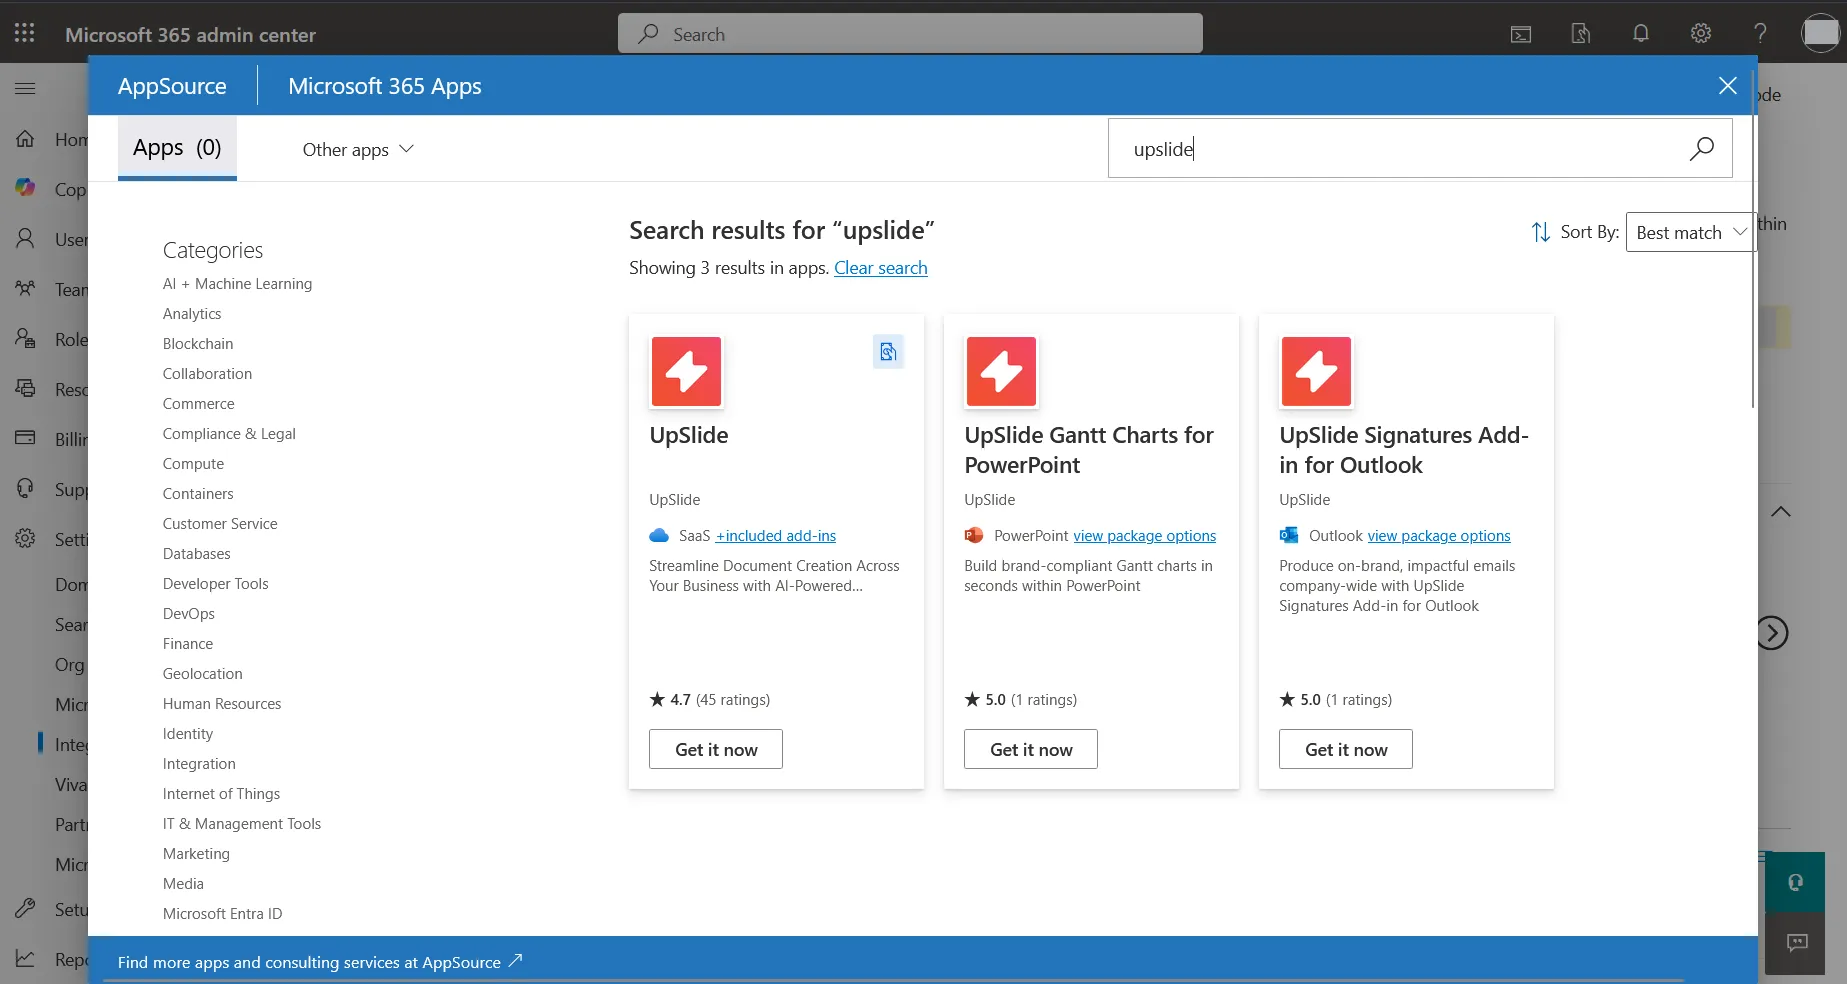
- In the search bar at the top-right, type “UpSlide” and click Get it Now on the application you wish to install
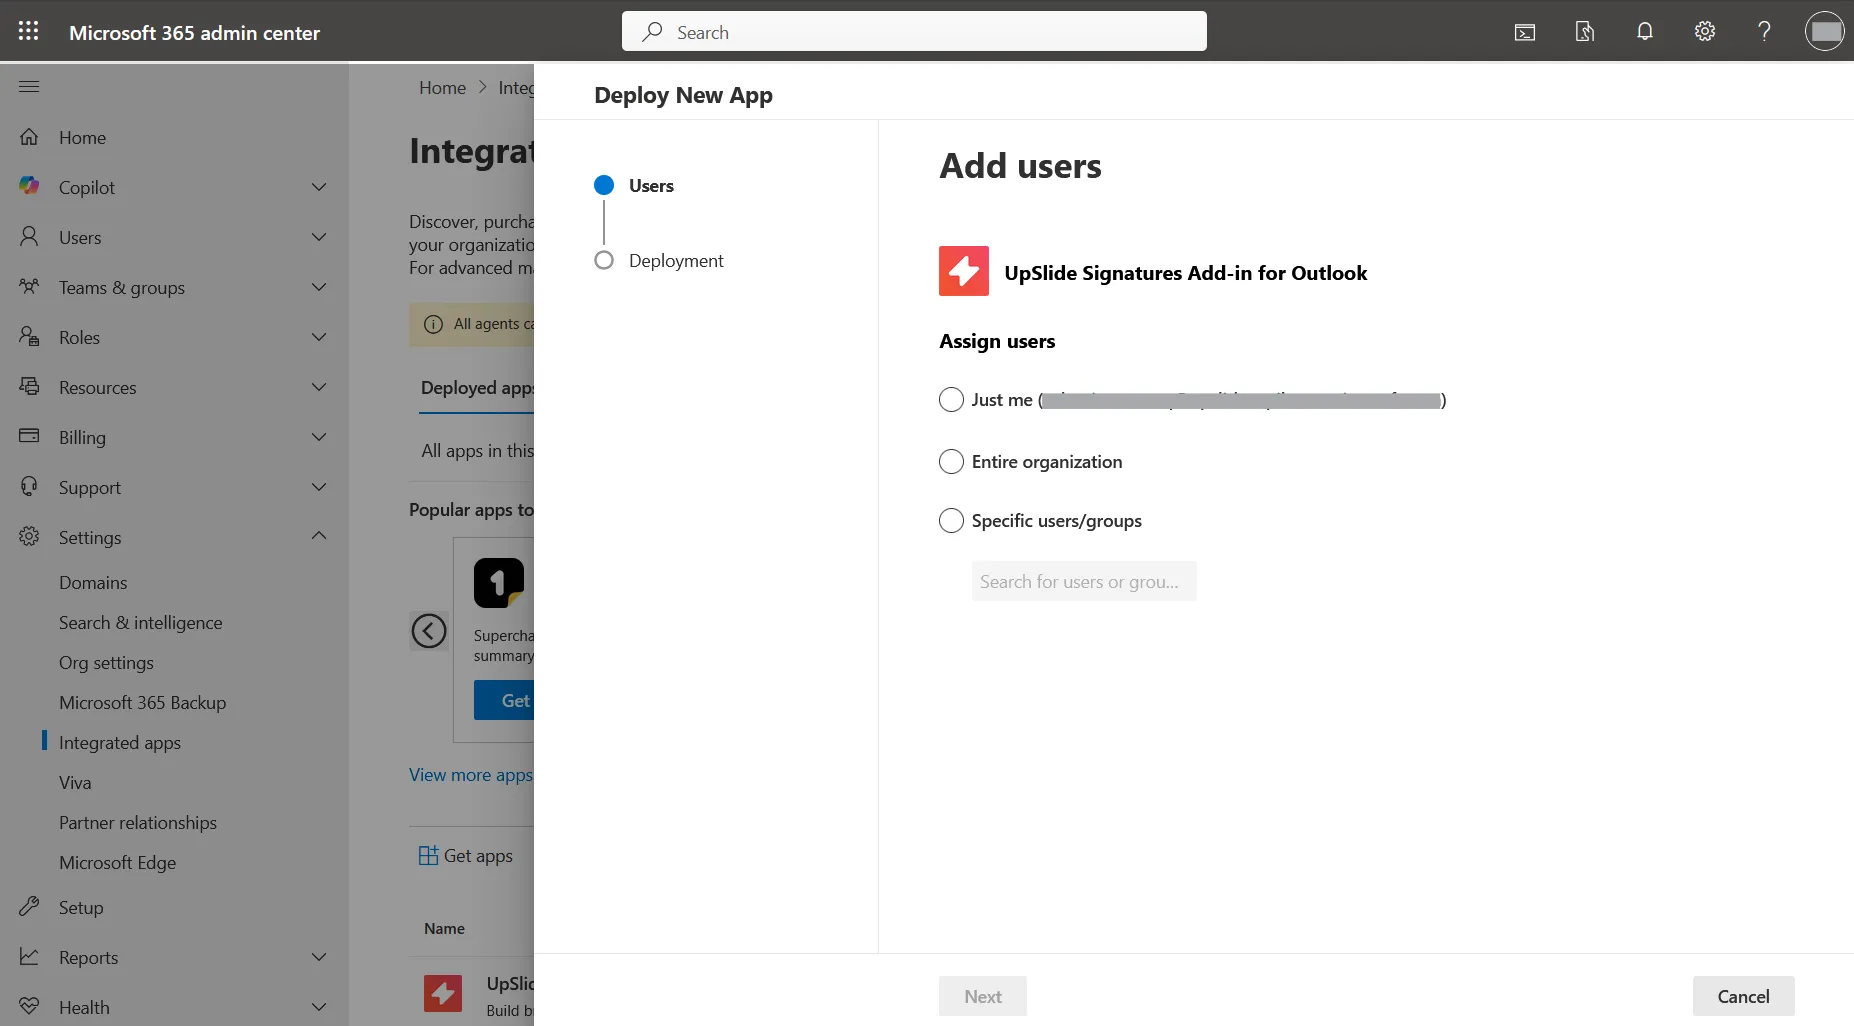
- Choose the deployment scope for the add-in
- Just me - The add-in will be accessible only to your account
- Entire organization - The add-in will be accessible to everyone in your organization
- Specific users/groups - The add-in will be accessible only for the specific users and user groups you select below.
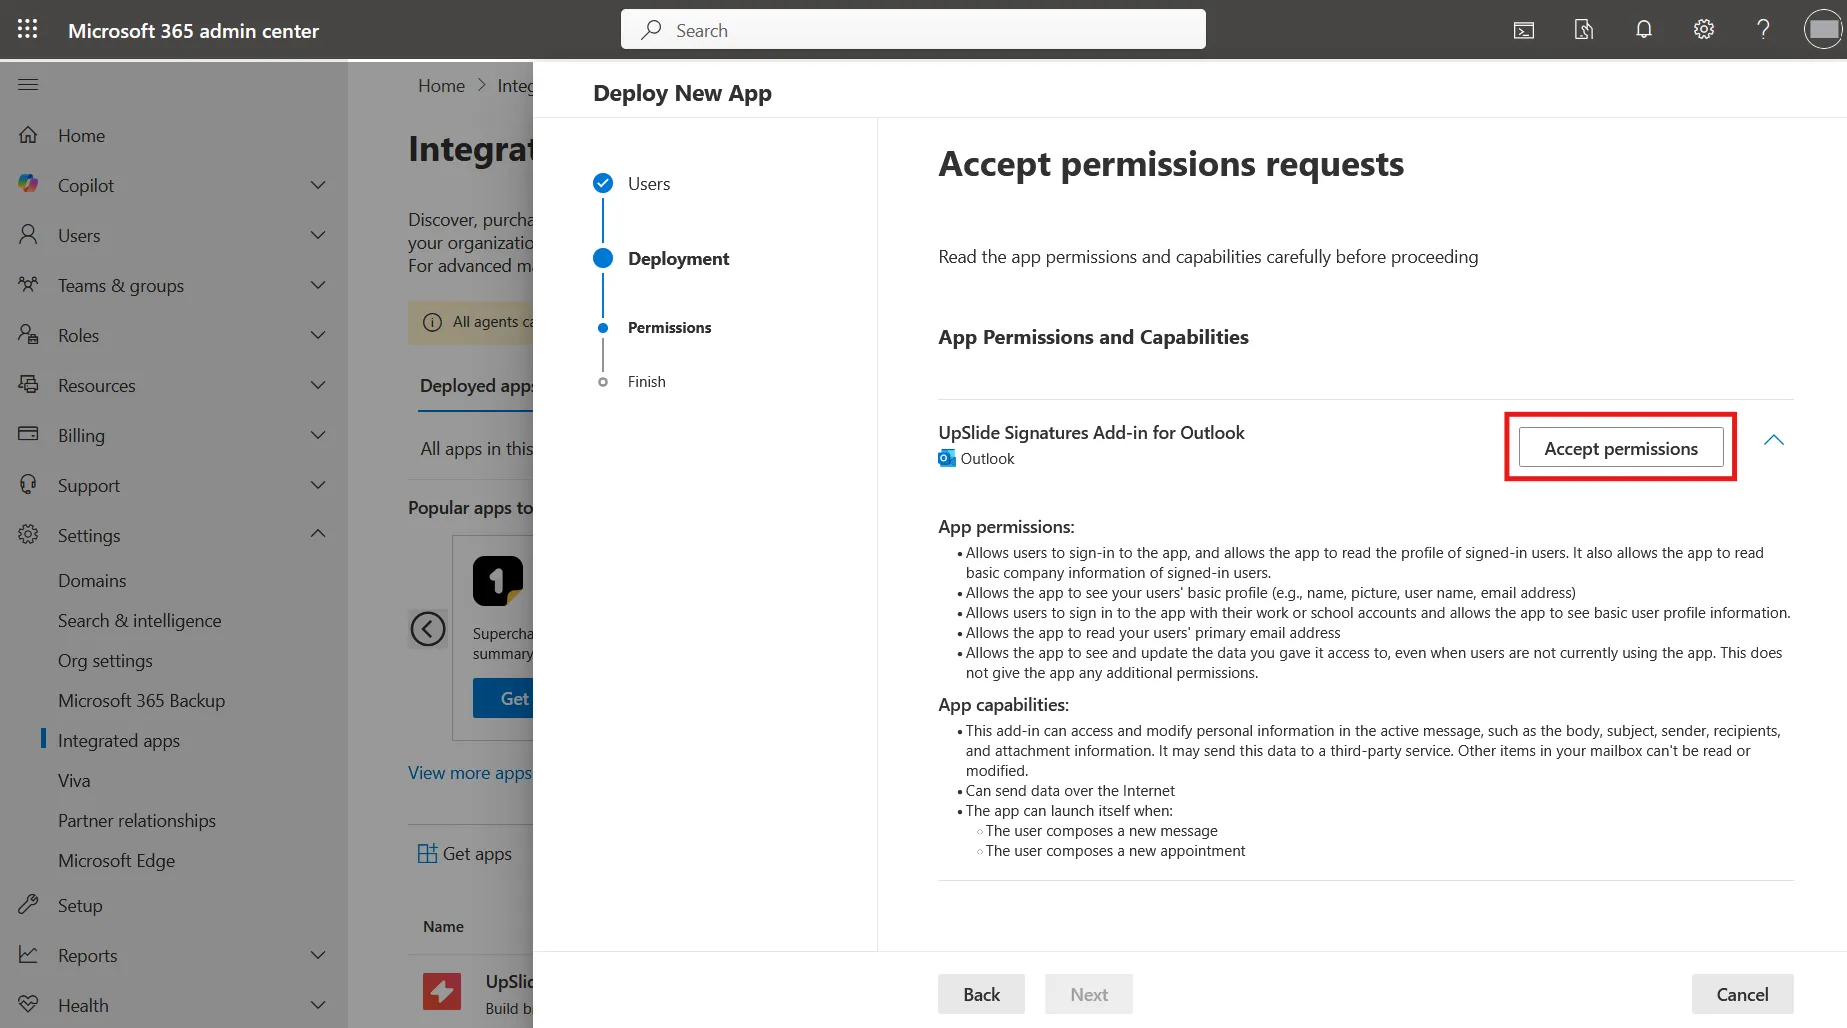
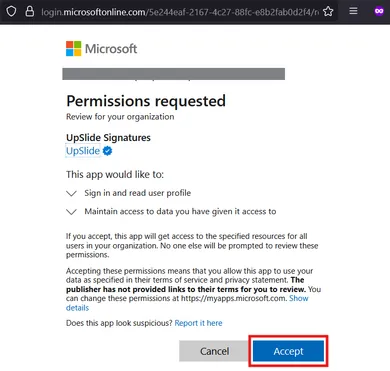
- Accept the required permissions for your organization. A confirmation pop-up will appear to confirm the action. Then, click on Next in your main window.
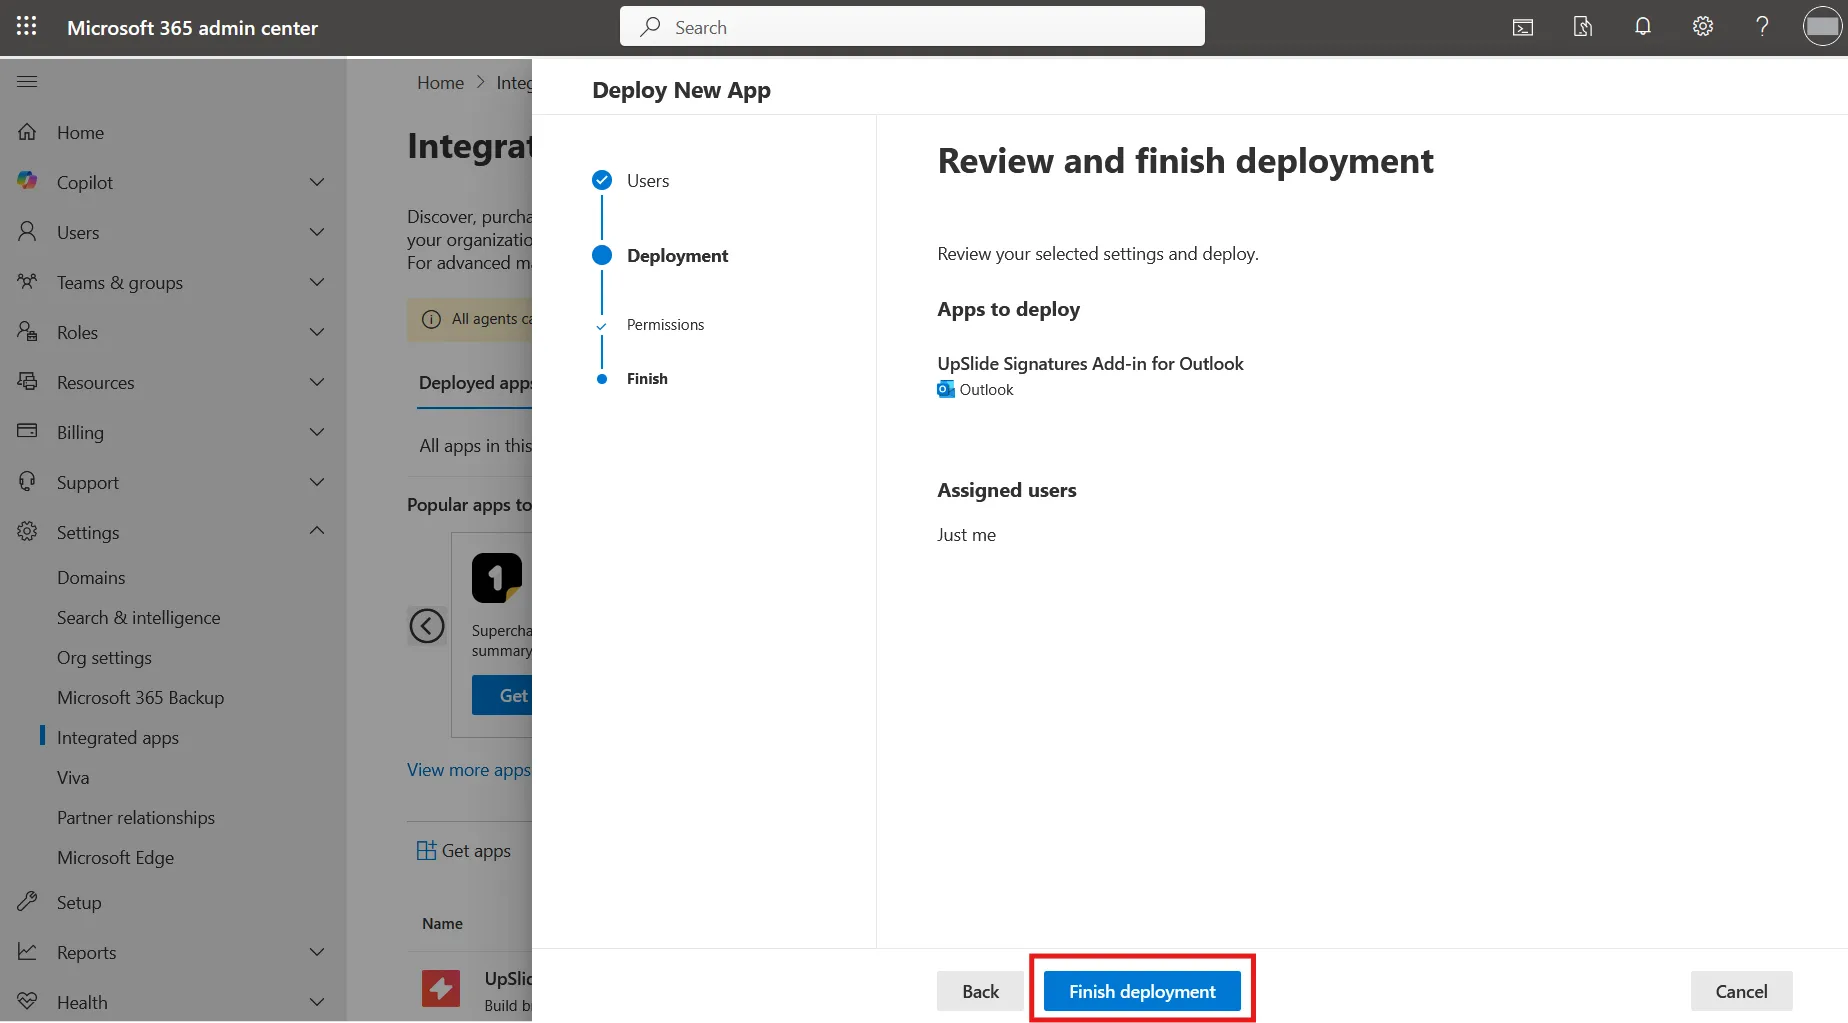
- Review your deployment scope and click on Finish deployment to finalize the installation
Manage deployment scope
You can change the deployment scope at anytime.
- Click here to access the integrated apps of your organization
- Select the app for which you want to edit the deployment scope
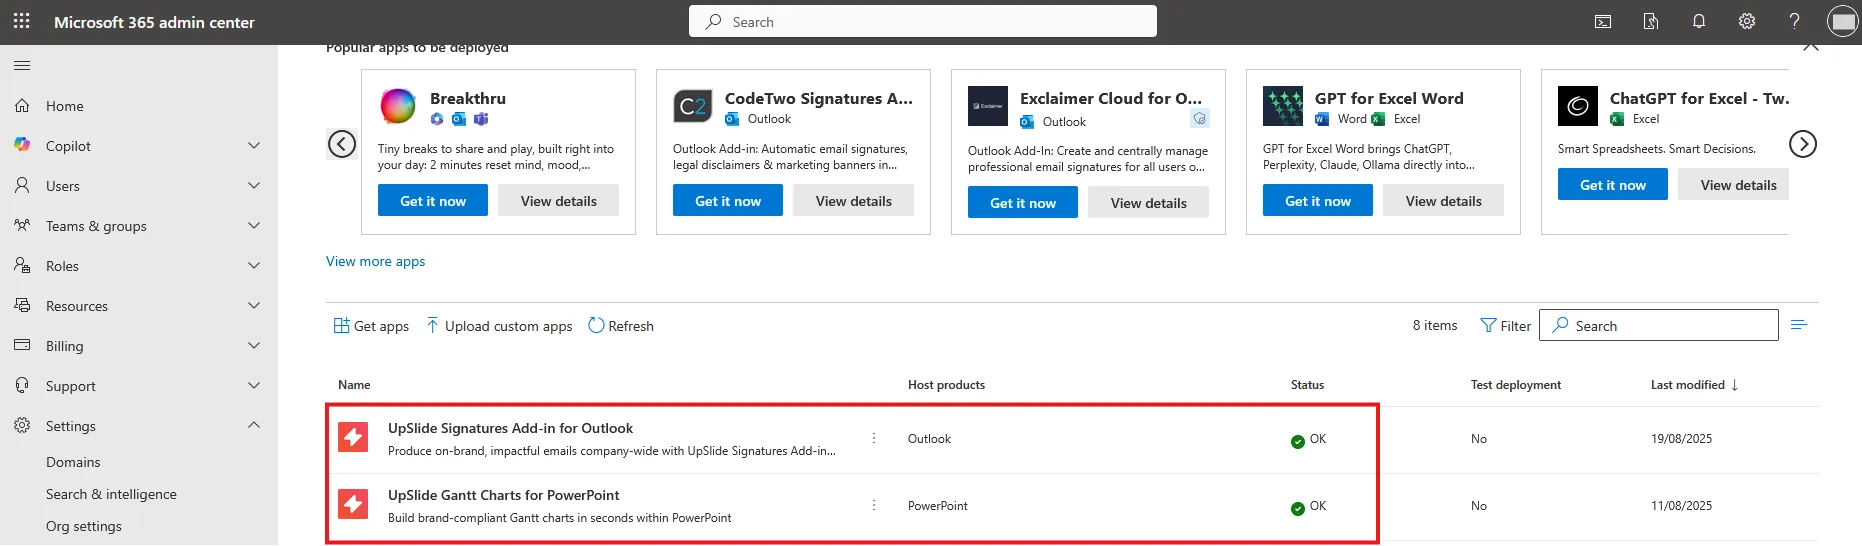
- Navigate to the Users sub-page and modify the assigned users. Click the Update button to confirm your new deployment scope.
Use Gantt Charts
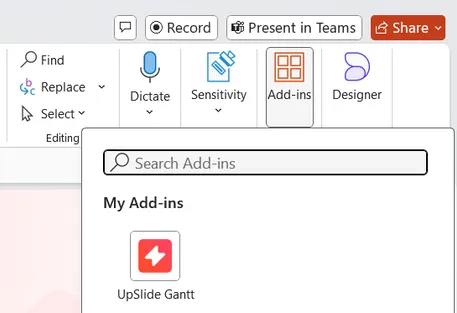
You can access the option by going in PowerPoint in Home > Add-ins > UpSlide Gantt.
You can now also have the Gantt Charts button appear directly in the UpSlide ribbon tab in PowerPoint desktop. Please contact UpSlide for the button to appear there.