When exporting Excel content to PowerPoint via UpSlide, you may notice that the scale width and scale height values shown in PowerPoint's Format Picture pane do not exactly match the Resize ratio you set in the UpSlide Settings. This discrepancy is expected and stems from differences in how Excel and PowerPoint handle unit conversions, borders, and rendering. It does not affect the accuracy of your export or the final visual result.
Finding the Resize ratio
You can find the value the Resize ratio is set to by opening UpSlide Settings in Excel and selecting the Export tab.
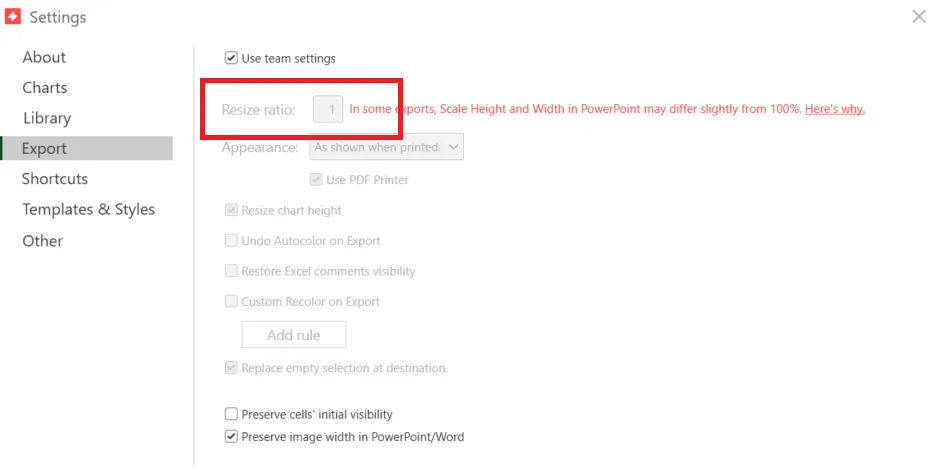
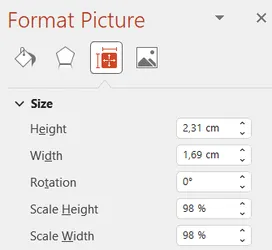
You may notice the ratio in PowerPoint isn’t equal to the one found in your settings. For example, the ratio can be set to 1 in the Settings, but the visual is exported to PowerPoint at 98% according to the Format Picture pane.
Understanding the difference between UpSlide’s Resize ratio and PowerPoint’s scale values
When you export a visual from Excel to PowerPoint via UpSlide, the scale width and scale height displayed in PowerPoint’s Format Picture pane may not exactly match the Resize Ratio set in UpSlide.
UpSlide exports visuals using the Enhanced Metafile (EMF) format, which requires converting Excel’s internal unit system based on character width into PowerPoint’s standard measurements of centimetres or inches. This conversion, combined with how each application handles rounding, borders, and rendering, can introduce minor differences in the final displayed values.
Example:
You export a one-column table from Excel with a column width of 1.80 cm and a Resize Ratio of 1 in UpSlide
In PowerPoint, you might see:
- Original Width: 1.83cm (rounded due to Excel’s cell borders)
- Displayed Width: 1.80 cm (after PowerPoint applies its rendering)
PowerPoint calculates the Scale Width as:
- 1.80 ÷ 1.83 = 0.983, rounded to 98%
The displayed width in PowerPoint matches that in Excel: UpSlide’s Resize ratio is applied precisely as specified. However, because PowerPoint calculates the scale width and scale height using its own reference for the original dimensions, the ratios shown in the Format Picture pane may appear slightly different. This is a display discrepancy only and does not affect the final visual result.
Going Deeper
Excel units and rendering differences
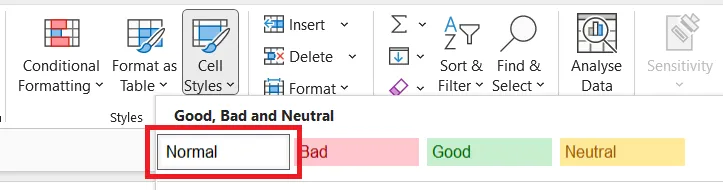
Excel does not use centimetres or inches as its default unit of measurement. Instead, one unit of column width in Excel corresponds to the width of a single character in the workbook’s “Normal” style. When an UpSlide link is created, these character-based units are converted into standard measurements to match PowerPoint’s coordinate system.
Impact of borders
How Excel handles borders
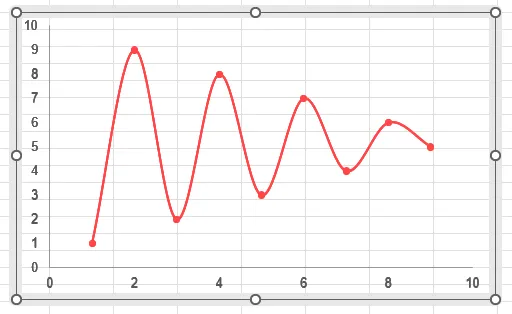
When a chart has a border in Excel, the border is split into two equal parts: 5pt inward and 5pt outward. This means the border expands both inside and outside the chart’s defined boundaries. It does not change the chart’s core dimensions, but it does increase the overall space the chart occupies.
How UpSlide handles borders on export
When UpSlide exports a chart, it targets the chart’s size without its borders. Excel, on the other hand, accounts for the border and calculates a larger overall size.
- For charts exported without a border, whether as a static image or via an UpSlide link, the borderless image appears visually smaller than its bordered counterpart, but the chart itself is the same. The added size directly corresponds to the outward extension of the border.
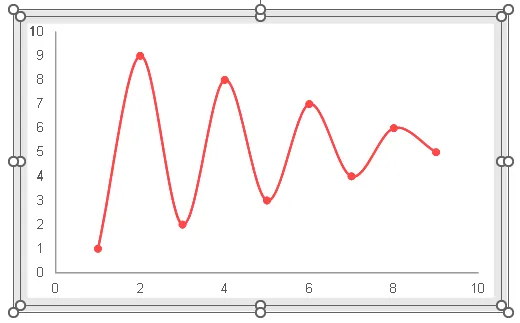
- For charts exported with a border via an UpSlide link, UpSlide starts from the border-inclusive size calculated by Excel, then adjusts the dimensions to align with the borderless target size. Because the aspect ratio must be preserved during this adjustment, the result is often a linked chart that is very slightly taller than its static equivalent, creating a small discrepancy between the border-inclusive Excel size and the final rendered size in PowerPoint.
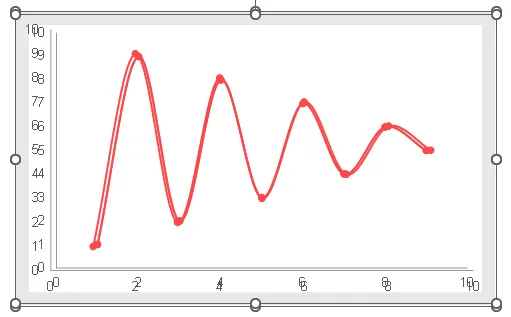
How to read scale discrepancy
The scale ratio shown in PowerPoint’s Format Picture pane depends on which size is used as the reference:
- If the reference is the original Excel chart with borders, the PowerPoint scale will be slightly below 100% because UpSlide targets the smaller, borderless size.
- If the reference is the borderless chart size, the scale is effectively 100%.
- The thicker the border, the more noticeable the difference in scale.