When building a Waterfall chart in Excel, UpSlide may display a warning if it detects an issue with the structure or values of your data. This article explains the cause of the warning and how to adjust your data to resolve it.
Common warnings
Inconsistent values
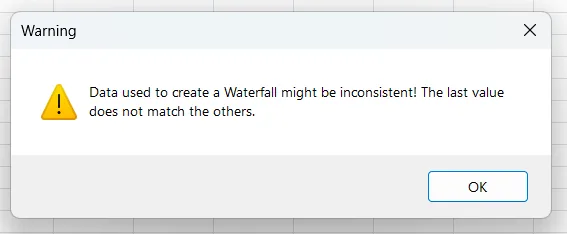
In a Waterfall chart, the first and last values must be results (totals), not effects (variations). Each intermediate value must also equal the sum of the previous intermediate value and the effects that follow it. If this isn’t the case in the source data, UpSlide will throw the warning “Data used to create a bridge might be inconsistent! The last value does not match the others”.
The easiest way to ensure this is to build your intermediate values using formulas. This prevents the warning from appearing. Note that UpSlide applies a small margin for rounding errors, so minor discrepancies will not trigger the warning.
Several representations for one data set
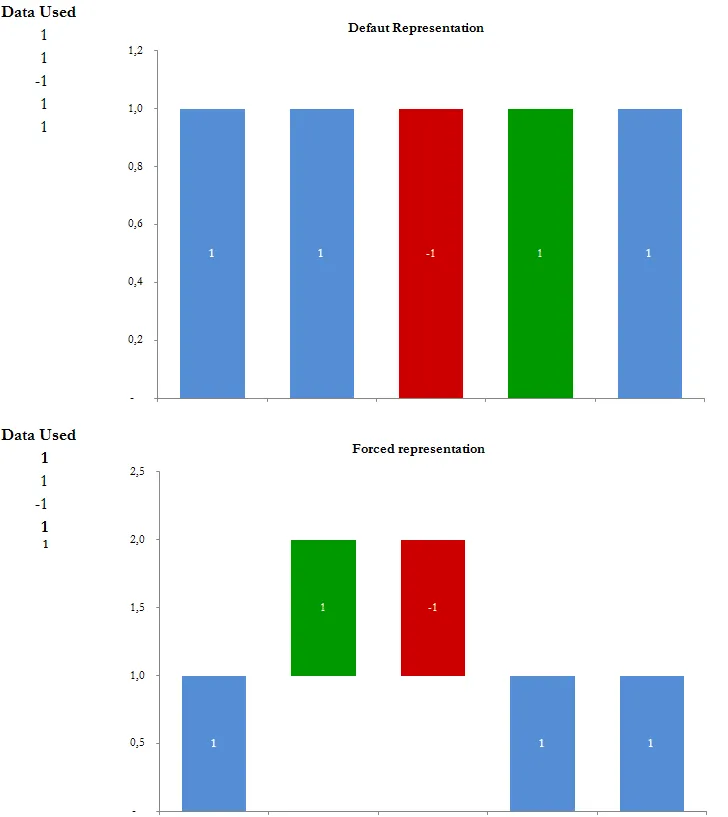
In rare cases, your data may produce two valid representations (see example below). The warning in this scenario reads “Several representations are consistent with the data. If the result does not match what you expect, please apply a bold font to intermediary results.”
To force a specific result, apply bold formatting to the result values.