Export as PowerPoint chart exports an Excel chart as a native, editable PowerPoint chart instead of a picture. The chart stays linked to Excel, so you can update its values without losing the formatting and size you set in PowerPoint.
Why use Export as PowerPoint chart
The standard Excel Link exports your chart as a linked picture. You cannot edit individual chart elements in PowerPoint. Export as PowerPoint chart creates a real PowerPoint chart instead, making it the right choice when you need:
- More flexibility. Format and resize the chart directly in PowerPoint, where you build your presentation.
- Less rework. Update values from Excel without reapplying your PowerPoint formatting.
- Different views of the same data. Give each linked copy of a chart its own formatting and size.
Export a chart as a PowerPoint chart
To export an Excel chart as a PowerPoint chart:
- Select the chart that you want to export in Excel.
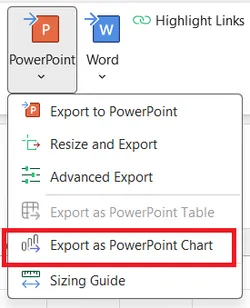
- Navigate to the Export to PowerPoint drop-down in the UpSlide ribbon.
- Select Export as a PowerPoint chart.
UpSlide inserts a native PowerPoint chart on your slide, linked to the Excel source.
Update the PowerPoint chart
Once exported, the chart behaves like any native PowerPoint chart. You can adjust its colors, axes, legend, data labels, and fonts directly in PowerPoint, and resize it to fit a placeholder. You can also change the chart type if you decide the current one isn’t a good representation of your data.
Excel remains the source of truth for the data. When you update the link, the values refresh from Excel while your PowerPoint formatting and size stay in place.
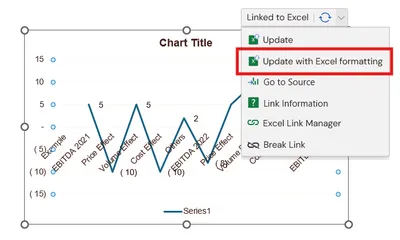
If at any point you want to force the Excel formatting back to your PowerPoint chart, select your chart in PowerPoint and click Update with Excel formatting.