Power BI is great for displaying live data, but you can't display written commentary. Our link is designed to allow you to use Power BI visuals within PowerPoint or Word to retain the storytelling flexibility of these applications.
Prerequisites
Before you use our link, please follow some prerequisite steps:
- Get the UpSlide Power BI to PowerPoint link
- Power BI to PowerPoint/Word link IT prerequisites
Note:
UpSlide's Power BI panel uses Microsoft Edge. If you use other browsers to update your reports online, their aspects may not match when exported in PowerPoint and Word. Make sure to use Microsoft Edge to make your modifications and visualize your reports before exporting them.
Creating your link
- Publish your Power BI report online in your workspace.
- In PowerPoint, choose the slide and placeholder you want to add your visual to. In Word, place the cursor where you want to add your visual.
- Click the Import Power BI Visuals button
- The Power BI window will open. Now connect to your Office 365 account, the same you use to publish your Power BI report online in your workspace.
- Apply filters on the visuals.
- Export by right-clicking on each visual and then choosing Export to PowerPoint/Word.
Link a whole page
You can also export the whole page of your report following the tutorial above.
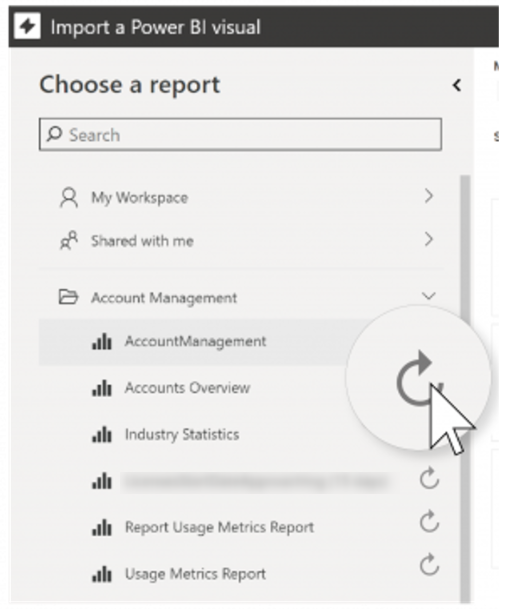
Tip
Prior to creating a linked visual/page, you can use UpSlide to force Power BI to refresh the data. Within the UpSlide import window, use the refresh icon next to the report name.
Information in the update panel
The Update Links panel in PowerPoint/Word shows you for each visual the:
- Visual title
- Tab title
- Last modification
- Author
- Dashboard Title
- Applied filters
If all your exported visuals are not in the Update links pane, click on the Refresh list button at the bottom of the pane.
Tip
You can open your Power BI report from the Update Links pane by clicking on the Open report link
Update visuals and pages
- In PowerPoint/Word, press Update Links button.
- Select the visuals you want to update.
- Click on the Update button at the bottom of the pane.
Our Power BI to PowerPoint/Word link has limitations. Check our documentation here to make sure your report is compatible with our link.